The Consultancy Tools not only produce datasets, graphs and reporting for iOS and macOS; they also generates a series of scripts that are linked together to produce an automated process that can be run again and again as additional files are imported.
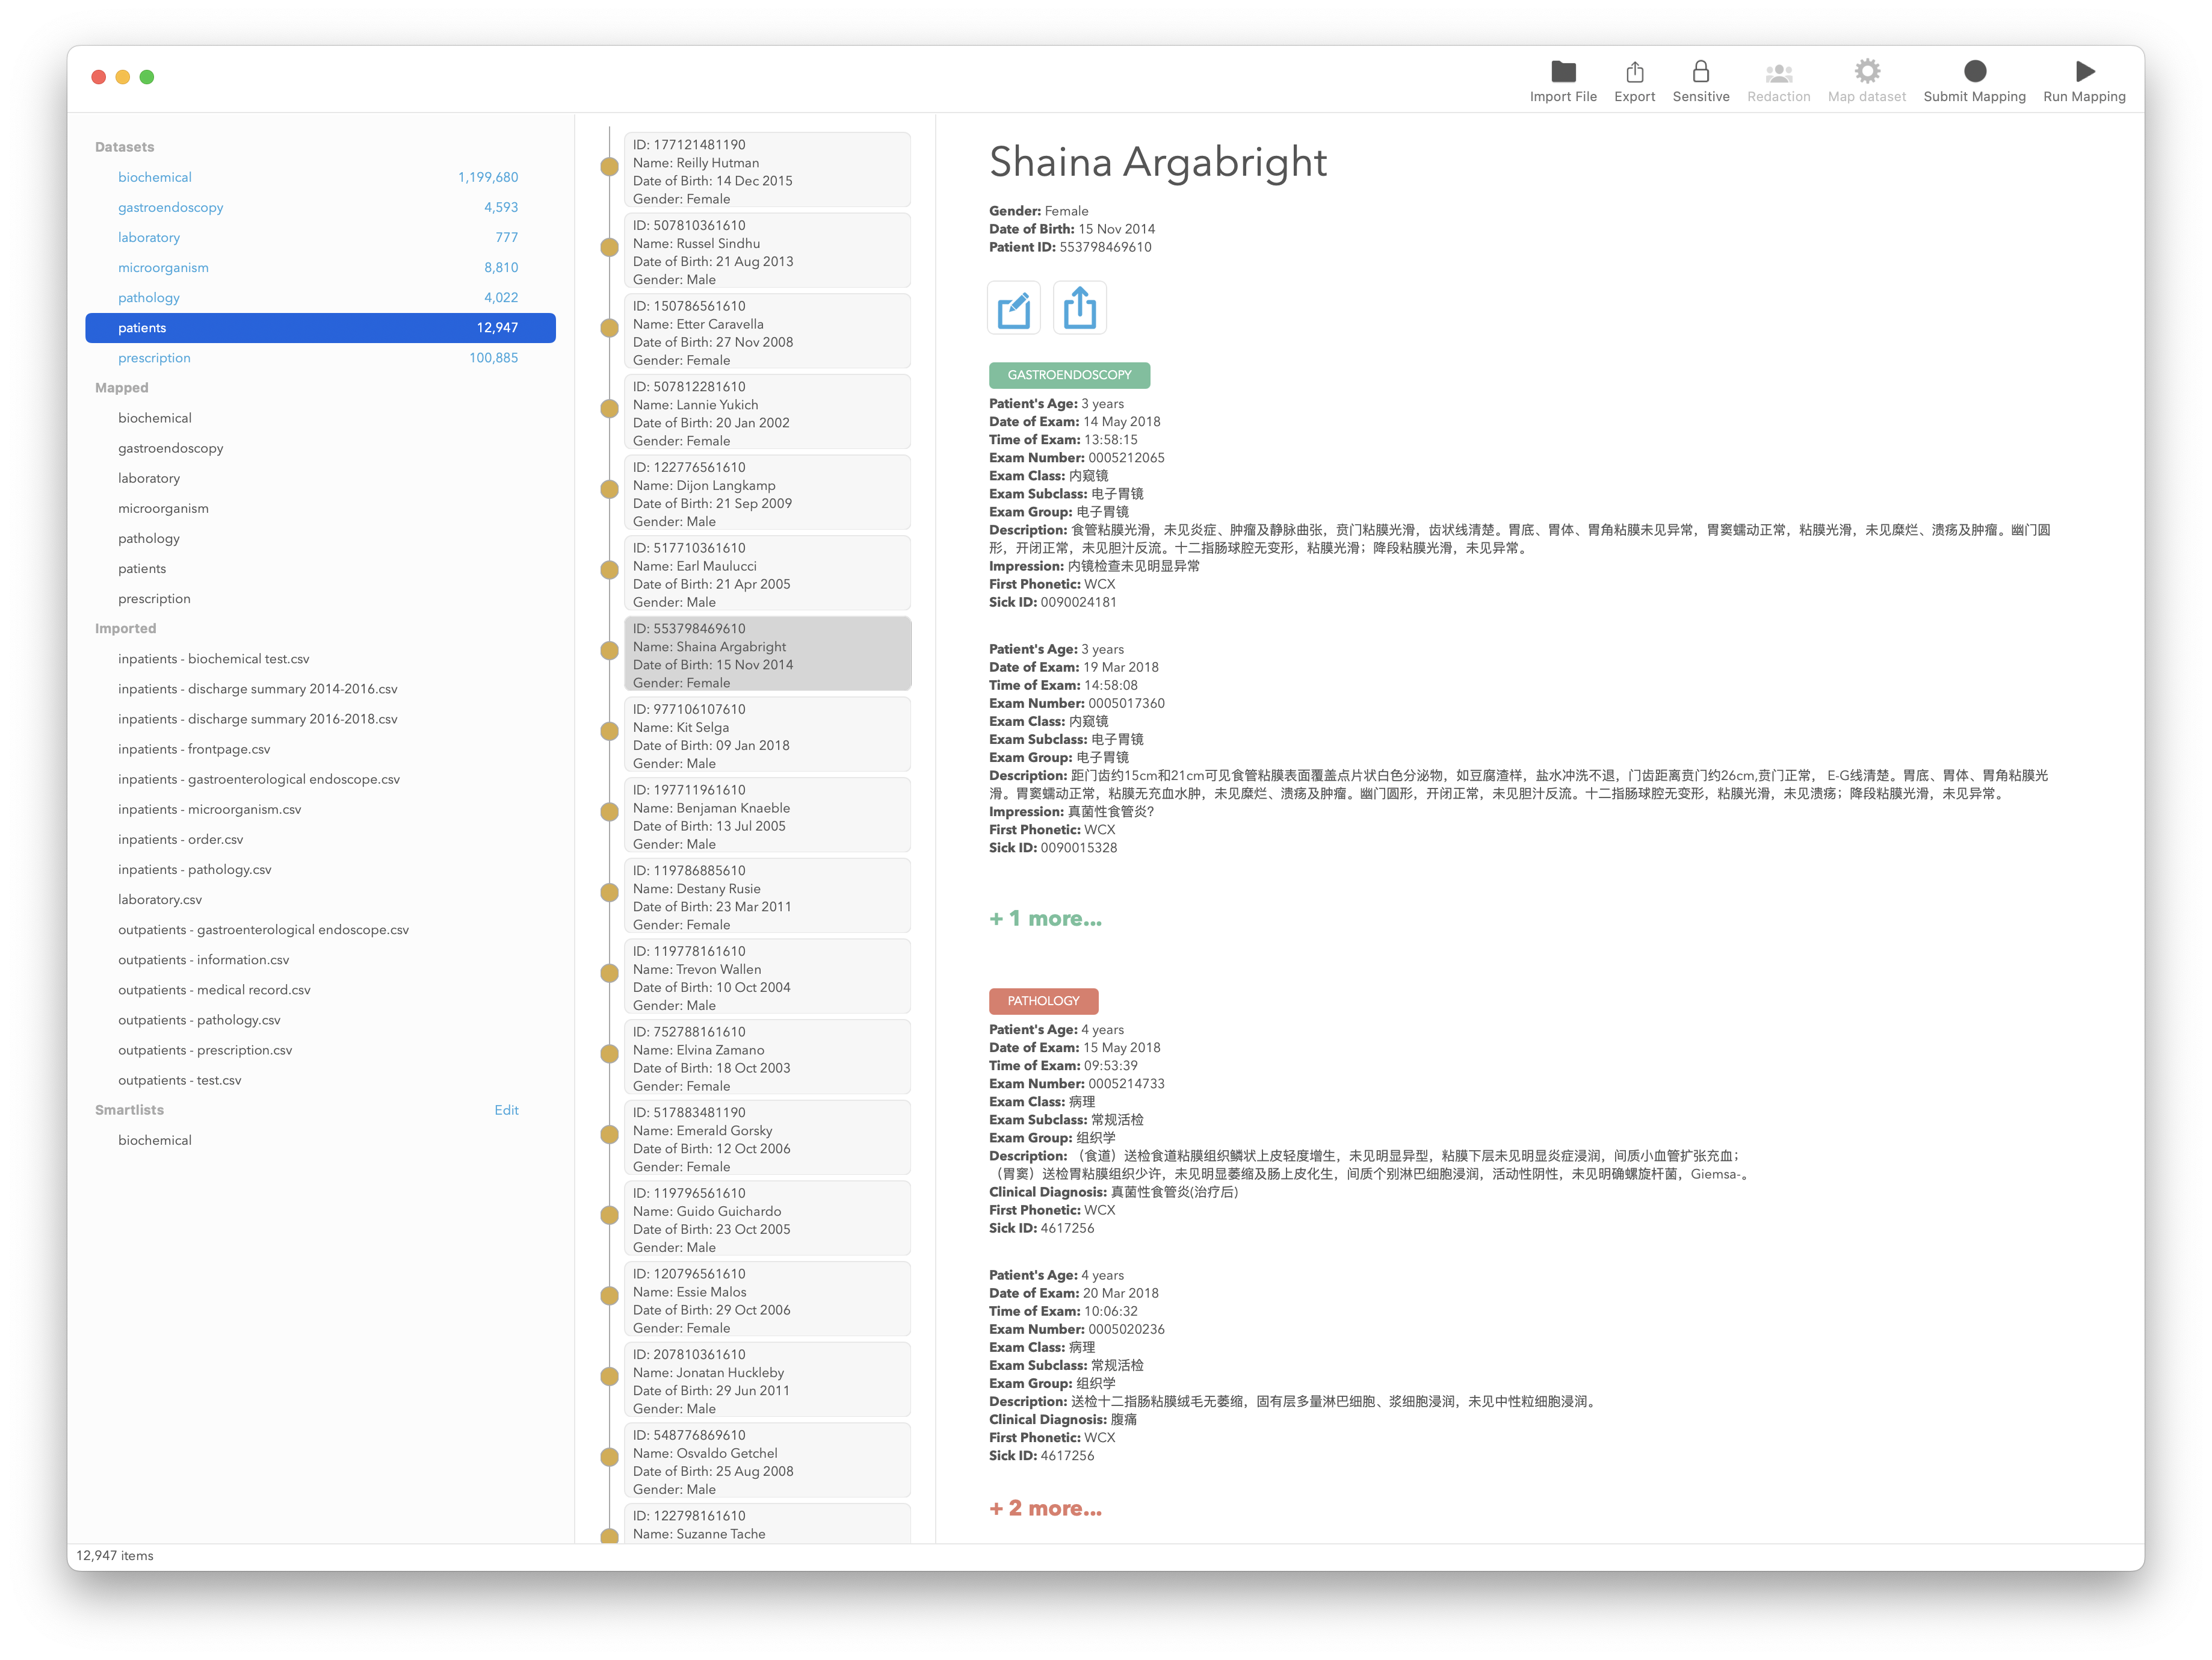
Data sensitivity is also something that we take seriously and a feature within the Graphical User Interface (GUI)allows you to hide or disguise any field from the imported .csv or the generated dataset. Names are aliased and dates are advanced or retarded relative to the original data so that the integrity of timelines, ages and demographics are maintained
Smartlists are generated during the mapping process and these are presented as menu items within the GUI. These list are a useful way of isolating particular characteristics within the dataset such as age, gender and medical history. Frequently used lists and lists containing large amounts of data are automatically loaded but can be added or removed from the menu as required.